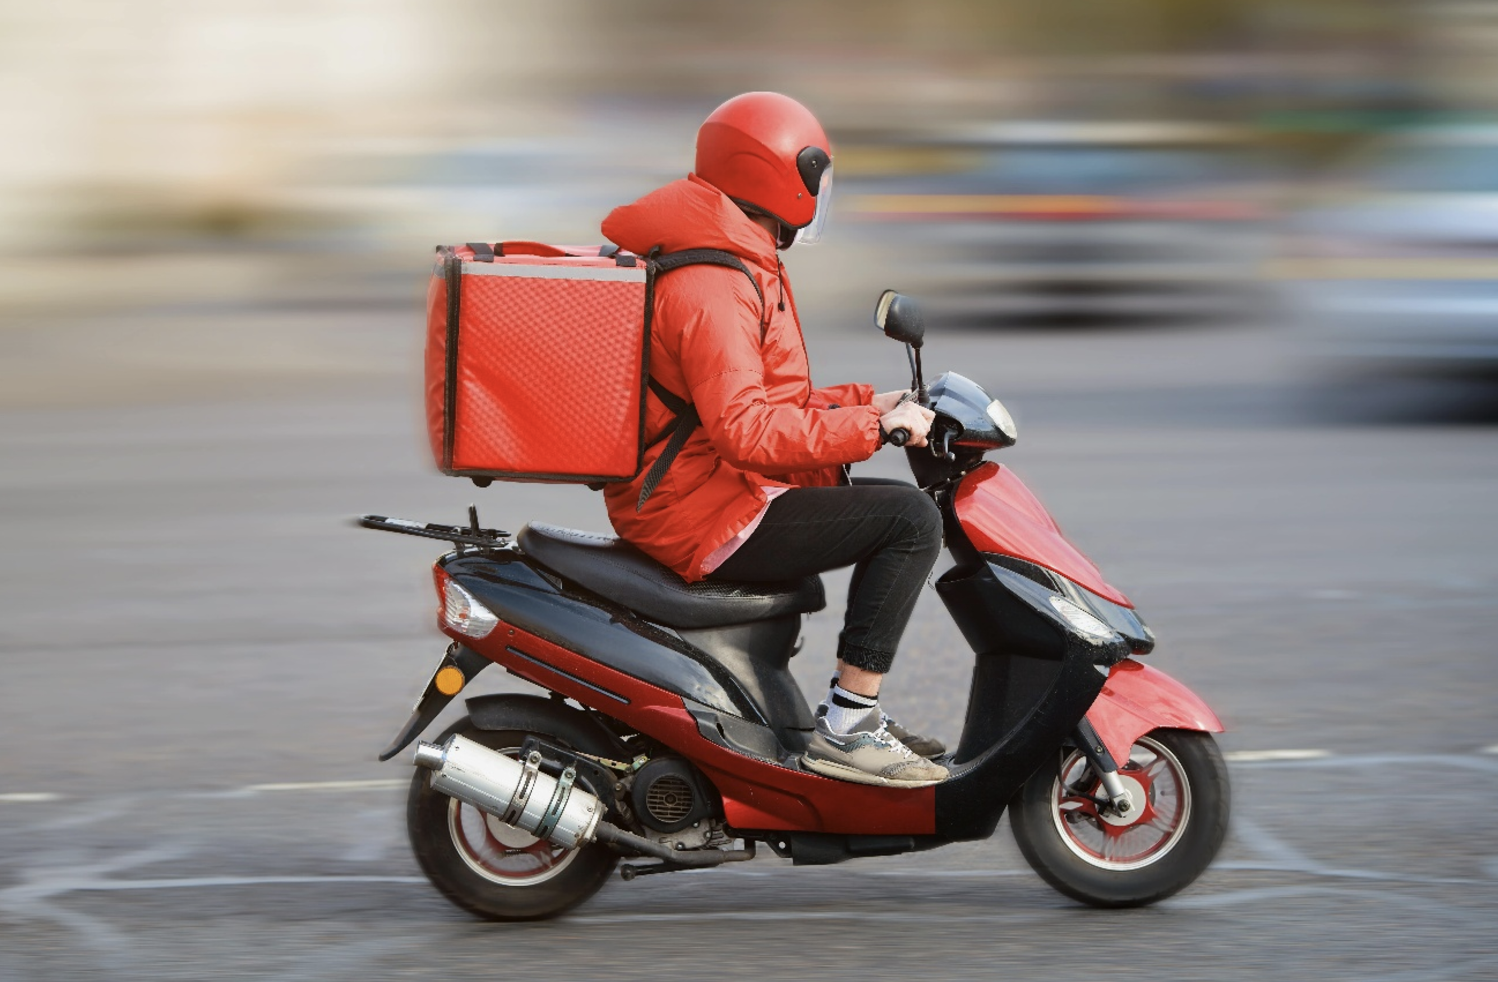
Motorbike owners, look away now. New data obtained via Freedom of Information requests has revealed Britain’s most-stolen motorbike models, as well as the regions that are most at risk of motorbike theft.
Long story short: if you’re thinking of investing in improved security, don’t wait around.
How many bikes were reported stolen across the UK over the last 12 months?
Inquests submitted by bike, car and business van finance broker Anglo Scottish highlight that, between 1 June 2025 and 31 May 2026, there were 16,585 vehicles with a motorcycle body type description reported to the DVLA as stolen by the police; a 3.5% decrease from last year’s count of 17,178 vehicles.
Which bike makes and models were most at-risk of being stolen?
The dataset revealed that, like the previous year, the top ten most-stolen models were all lightweight ‘commuter scooters’ manufactured by a Japanese brand – either Honda or Yamaha.
|
Motorcycle Make and Model |
Number of motorcycles recorded as stolen |
|
YAMAHA GPD125-A NMAX 125 ABS |
1,009 |
|
HONDA WW 125-A |
620 |
|
HONDA WW 125 EX2-H |
309 |
|
HONDA NSC 110 MPDH |
307 |
|
HONDA WW 125-A-M |
211 |
|
HONDA NSC 110 MPD-K |
192 |
|
HONDA WW 125 EX2-F |
186 |
|
YAMAHA YBR 125 |
179 |
|
HONDA WW 125 A-P |
175 |
|
HONDA NSC 110 E-E |
155 |
The Yamaha GPD125-A NMAX 125 ABS and the Honda WW 125-A continue to top the list of the most-stolen bikes, also topping the rankings in a previous data pull. These bikes are incredibly popular amongst a range of users for their nimbleness and manoeuvrability, suitable for city use and travelling further afield.
The worst places to own a bike: revealed
But which UK location reported the most bikes stolen? Unsurprisingly, London topped the list, with 2,603 bikes reported stolen during the chosen time period. This is more than five times the next-highest city, Bristol, which recorded 413 bike thefts in the same window. Birmingham was right behind, however, with 412.
Per capita, though, London did not rank as the most dangerous place to own a bike. Cross-referencing the top ten locations for reported bike thefts with that region’s most recent population – as per the 2021 Census – revealed that Nottingham was the UK’s hotspot for per-capita bike thefts. This city is followed closely by Bristol and the surprise inclusion of Cambridge.
|
Registered keeper’s address |
Motorcycles stolen, June 2024-2025 |
Area Population |
Reported Thefts Per 100,000 People |
|
NOTTINGHAM |
296 |
299,790 |
98 |
|
BRISTOL |
413 |
425,215 |
97 |
|
CAMBRIDGE |
132 |
145,700 |
90 |
|
SOUTHAMPTON |
209 |
248,922 |
84 |
|
HARROW |
179 |
261,300 |
69 |
|
STOKE-ON-TRENT |
162 |
260,560 |
62 |
|
MANCHESTER |
213 |
470,405 |
45 |
|
LEICESTER |
179 |
406,580 |
44 |
|
BIRMINGHAM |
412 |
1,121,375 |
37 |
|
LONDON |
2,603 |
8,776,535 |
30 |
According to data aggregation site Plumplot, Nottingham’s annual overall crime rate is 12% higher than the national average, though vehicle crime in general ranks at 92% of the national average.
This suggests that, though bike theft numbers are very high, theft of other types of vehicle (such as cars or vans) as well as theft from a vehicle – such as items left in cars or parts like catalytic converters – might be lower in Nottingham than the national average.
Either way, if you’re in Nottingham, it might be time to invest in some security for your bike…especially if it’s a Honda or Yamaha.
Anglo Scottish Finance: https://www.angloscottishfinance.co.uk/vehicle-finance/van-finance/